
Customer segmentation is a means by which you group customers into an identifiable category that you can use as a basis for analysis of a specific group of customers. Customer segmentation is useful for activities such as strategic planning, campaign planning & customer targeting, product analytics, planning customer communications, customer experience management, churn prediction, upselling, cross-selling, acquisition, sales operations and more.
I like behavioral attributes rather than segmentation based on attributes or a derived factor. Behavioral is based on something the customer DID, rather than an attribute externally assigned to the customer. Some good sources of behavior-based attributes include.
- Transactional history (soon to come my post about churn management and customer accounting). Within transactional history, a popular method of segmentation is using cohorts based on time of transaction. Other metrics include segmenting customers on recency, frequency and monetary value of the transaction.
- Social profile, which included connections, networks and affiliations both on- and offline.
- Sentiment, which is associated with attitude, but more specific to sentiment analysis as online (watch out for future blog on this).
Other factors: that are often used in customer segmentation include:
- Firmographic could include # employees, industry, etc.
- Demographic could include age, marital status, location, income.
Due to their static nature, I caution against the use of firmographic and demographic factors as stand alone attributes in analysis. They say nothing about the intent, behaviors or attitudes of the customers.
Factors used for customer segmentation need to be SMART.
- Specific: Clearly defined scope
- Measurable & Manageable: You need to be able to measure it and collect the data reliably.
- Should be based on a hypothesis that you can prove or disprove with data or information available to YOU at a reasonable cost
- Actionable within your organization : somebody should own the decision and thus the ability to prove/disprove a hypothesis
- Relevant to your goal: Current drivers + future accelerators = Value bringing you towards your goal
- Trending : The data and information should be available over a significant window of time & available at the necessary intervals
Rule based and analytics driven
Rule-based segmentation is based on criteria such as Boolean logic or thresholds and is often two dimensional. This is traditionally the easiest type of targeting for many professionals, as one can do it by filtering in Excel. For example, marketers have traditionally segmented customers based on heuristics such as the industry, company size (in B2B) or age, income, etc (in B2C).
This method is often based on descriptive analytics and business logic. While this method is easy, intuitive and accessible to most marketing professionals, even segmentation is based on robust statistical analysis, the reliance on a limited, fixed number of attributes is restrictive in the granularity and scope. Moreover, rules-based tends to rely on heuristics developed over a time and slow to adapt to changes.
Analytics driven segmentation such as k-means clustering is a data-driven means of determining customers who are similar along specific variables. Because these clusters are based on similarity and statistical significance, they are helpful in predictive analytics. Thanks to the ability to collect and manage many different attributes and learn directly from the data, k-means clustering and other machine learning methods can be used for granular and dynamic customer segmentation.
Big data technologies and machine learning have enabled analytical-based clustering using unlabeled attributes. That means that marketers can segment their customers based on examining the data alone rather than on preconceived notions.
K-Means clustering is a type of unsupervised machine learning that uses data that is not assigned to a specific category or group, called unlabeled data. The algorithm works assigns the data points values based on features that are inputted. K-means clustering finds the most significant number of clusters and then determines the grouping of clusters based on the distance between the data points based on inputted attributes.
As the clusters are formed directly from the data itself rather than business rules or filtering, the results correspond to the direct truth of the data. Attributes that have not been traditionally considered might suddenly appear highly relevant. Customer segments are dynamic. Due to its direct nature, K-means clustering picks up on changes in clustering over time. Depending data availability, k-means clustering can deliver real-time or near-time customer segmentation.
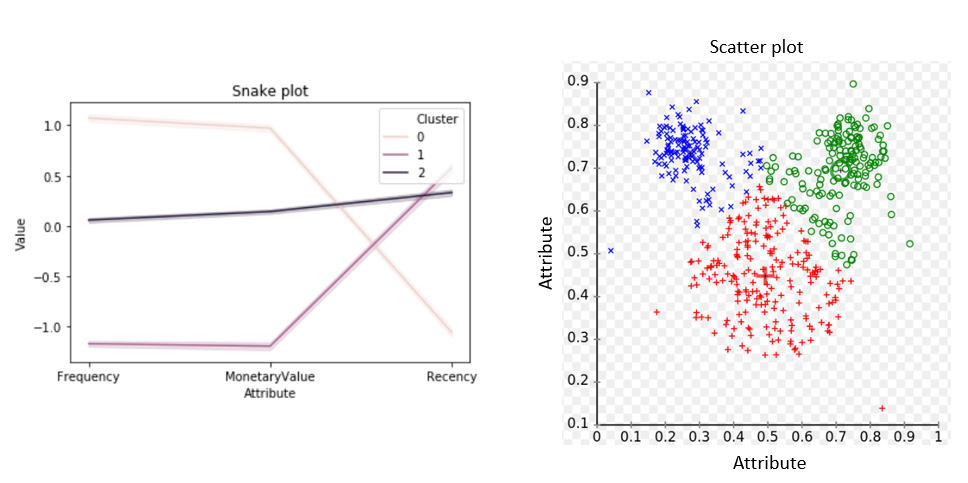
Snake plot: Below you can a plot of 3 clusters based on Frequency, Recency and Monetary Value in Online Retail. Here one can see the profiles of the 3 clusters based on the analyzed attributes. For example, Cluster 0 is the most attractive, Cluster 1 is the least attractive. Such classification enables analytics-based prioritization. This is a visualization that could be used by a business user, for example, a market strategist.
Beyond prioritizing Cluster 0 for marketing campaigns, this analysis offers insight into the types of companies who have affinity for the product. Further behavior-based attributes, for example from the customer journey, can be applied to gain more insight into the definition, actions and preferences of high-value customer segments.
Scatter plot: If you want a direct visualization of the data itself, a scatter plot can visualize the clusters directly. Due to the two-dimensional nature of most visualization tools currently available, this method has limitation. Additionally, this method is more suitable to data-savvy end-users.
Additional insight can be attained by looking at the attributes of the population within each cluster. Using k-means customer segmentation will allow you to form an up-to-date, insightful grouping of your customers based on important attributes that determine their behavior.
Stay tuned for more blogs about customer personas, churn analysis, product analysis and more.
Interested in implementing k-means clustering in your organization? Please contact me. Elizabeth.Press@d3mlabs.de
(Data Source for Snake Plot, UCI Online Retail Data, inspired by DataCamp examples, Wikipedia for K means)
Hi, this is a comment.
To get started with moderating, editing, and deleting comments, please visit the Comments screen in the dashboard.
Commenter avatars come from Gravatar.